Filter and customize your reports
Learn how to apply advanced filtering, save tailored views for your reports and create custom reports, helping you make informed decisions with the data that matters most to your business.
In this article
Get more from your reports with Insights
Upgrade to Insights to unlock more powerful ways to explore, organize and analyze your reporting data, such as:
- Advanced filtering: Dig deeper into your data with more flexible filters and conditions, helping you find the insights you need directly in Fresha without exporting your reports.
- Saved views: Save your go-to filters as views within each report, so you can quickly switch between different perspectives without filtering from scratch.
- Custom reports: Build reports around your business needs by customizing how data is grouped and displayed, including columns, date ranges, default filters and charts.
Apply advanced filters to report
-
From the main menu on the left of your screen, go to Reports.
-
Use the search bar at the top to enter the name or description of the report and click on the report you want to open.
-
From the toolbar in the top of your screen click on Advanced filters to filter the data shown in your report.
-
In the Advanced filters view, use the dropdown menus to define your filter criteria:
- Choose the data you want to filter by: such as items sold, sales, or gross sales.
- Select a condition option: such as more than or less than.
- Enter the value you want to apply: such as $50 or $100.
-
For example, you can filter the report to show items sold more than $100.
-
To add another filter, select Add rule. You can add an unlimited number of rules to a report.
- Use the dropdown to choose whether the new rule should be applied together with (And), or instead of (Or), the existing rule.
- You can drag and drop rules to change their priority order.
-
Click on the Apply button to filter your report.
Once you apply advanced filters to your report, the data will update based on the rules you set.
To remove an advanced filter, select the X next to the rule in the toolbar at the top of the screen.
Save a filtered view to a report
Save your report filters as a view you can return to anytime, without filtering from scratch.
- Open the report you want to customize.
- Use the Filters and Date range icons to tailor the data to your needs.
- Once you’ve selected your filters, click Apply at the bottom of the panel.
- From the toolbar in the top right, select Save view.
- Enter a name that helps you identify the view, such as “Sales per team member”.
- Click Save to create the view.
- Your saved view appears as a tab at the top of the report. To create another, click the + icon next to your saved view tabs.
Once saved, all team members with permission to access the report can also see and use the saved view.
You can drag and drop saved view tabs to change the order they appear in. Select the drop-down arrow next to a saved view to rename, duplicate, copy a link to share, or delete the view.
Customize standard reports
Personalize Fresha’s standard reports by adjusting them to your business goals and highlighting the insights most relevant to you.
- From the main menu on the left of your screen, go to Reports.
- In the left menu panel, select Standard to view your standard reports.
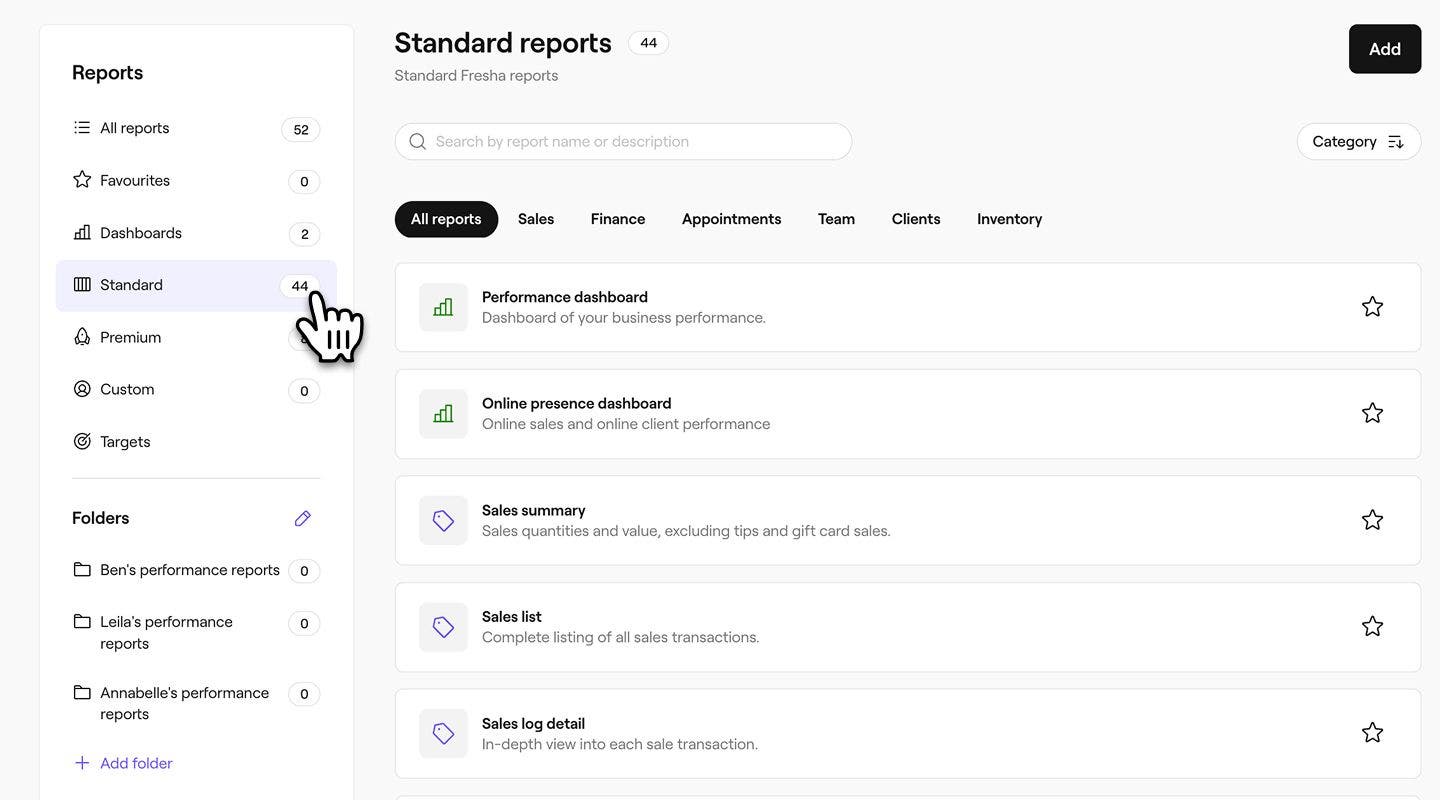
- Use the search bar at the top to enter the name or description of the report and click on the report you want to customize.
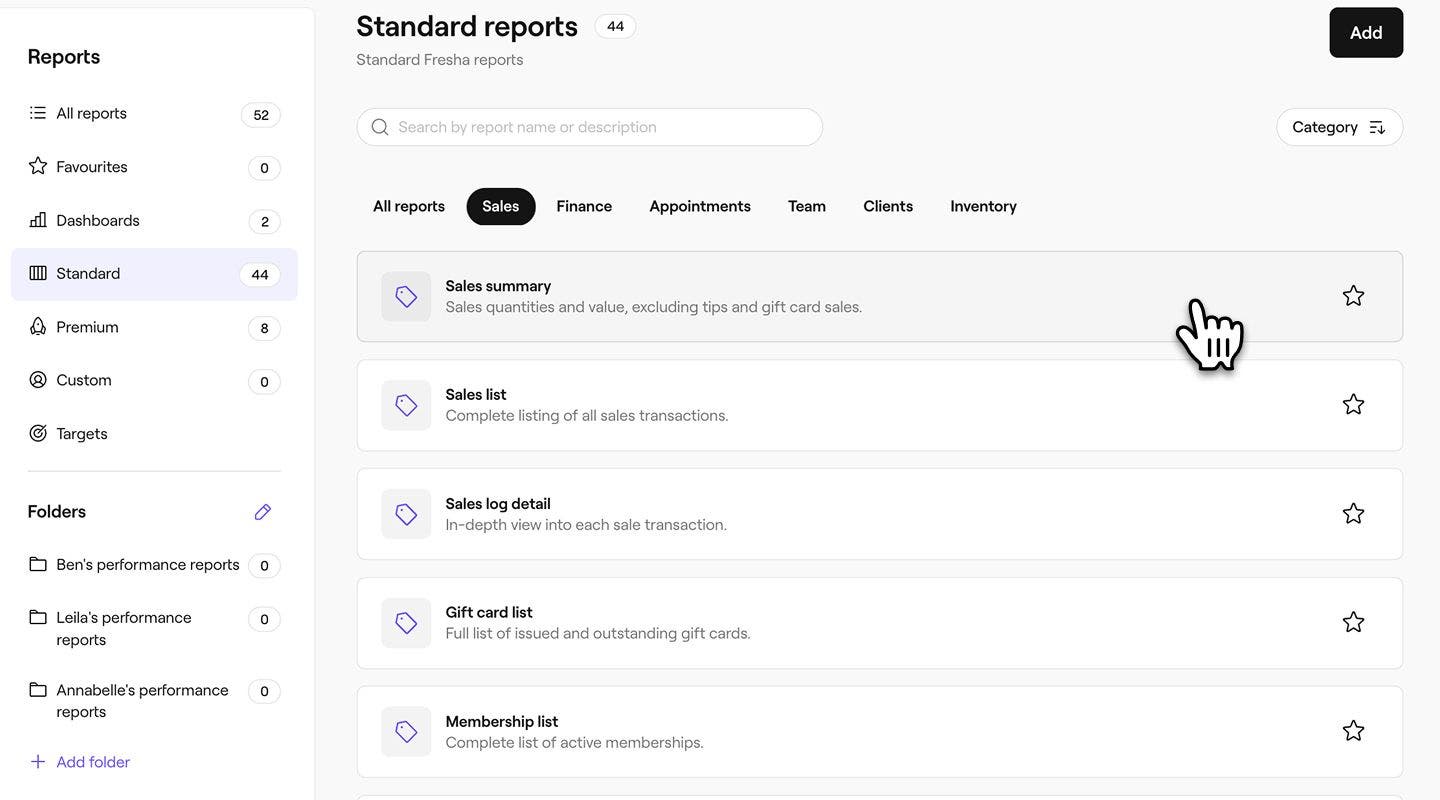
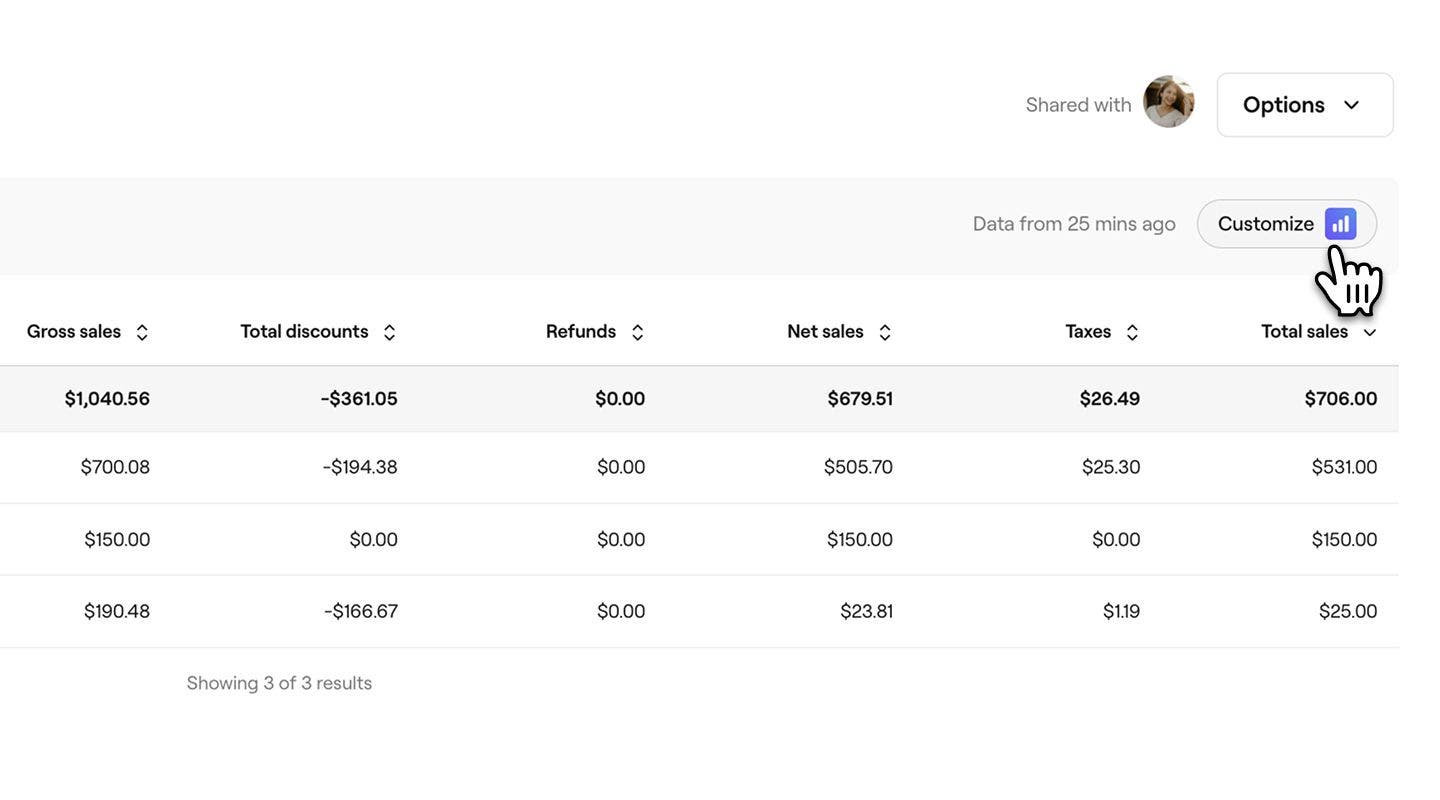
- From the toolbar in the top right of your screen, select the Customize icon to customize the report.
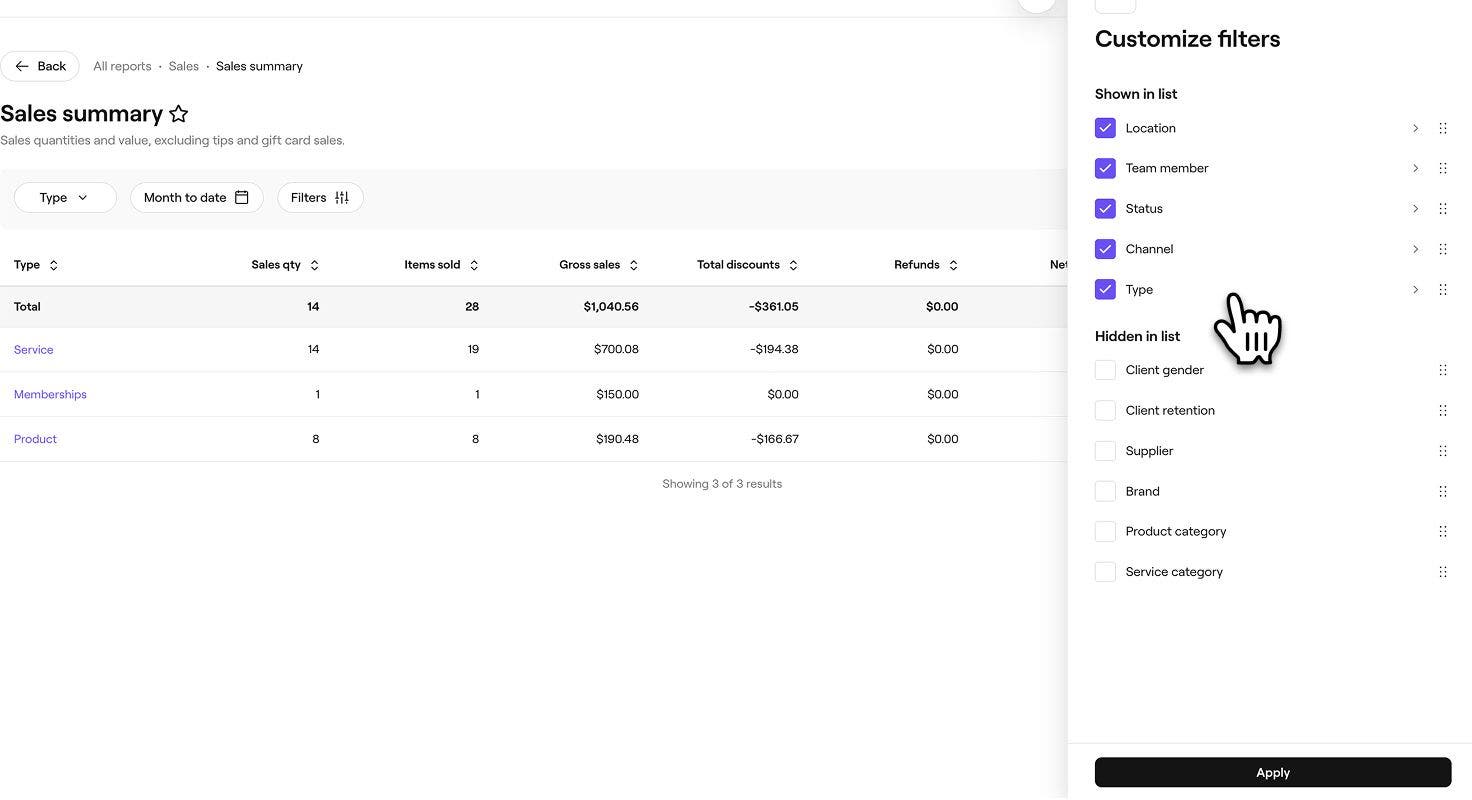
- In the right menu tab, use the Customizemenu to tailor the report to your needs. Open each filter tab and select the data you want to include, making sure the areas you’d like to see in the report are checked.

- Once you have selected the filters you would like to see in the report, click on the Apply button at the bottom of the panel.
- From the toolbar in the top right of your screen, select the Save button to save the custom report.

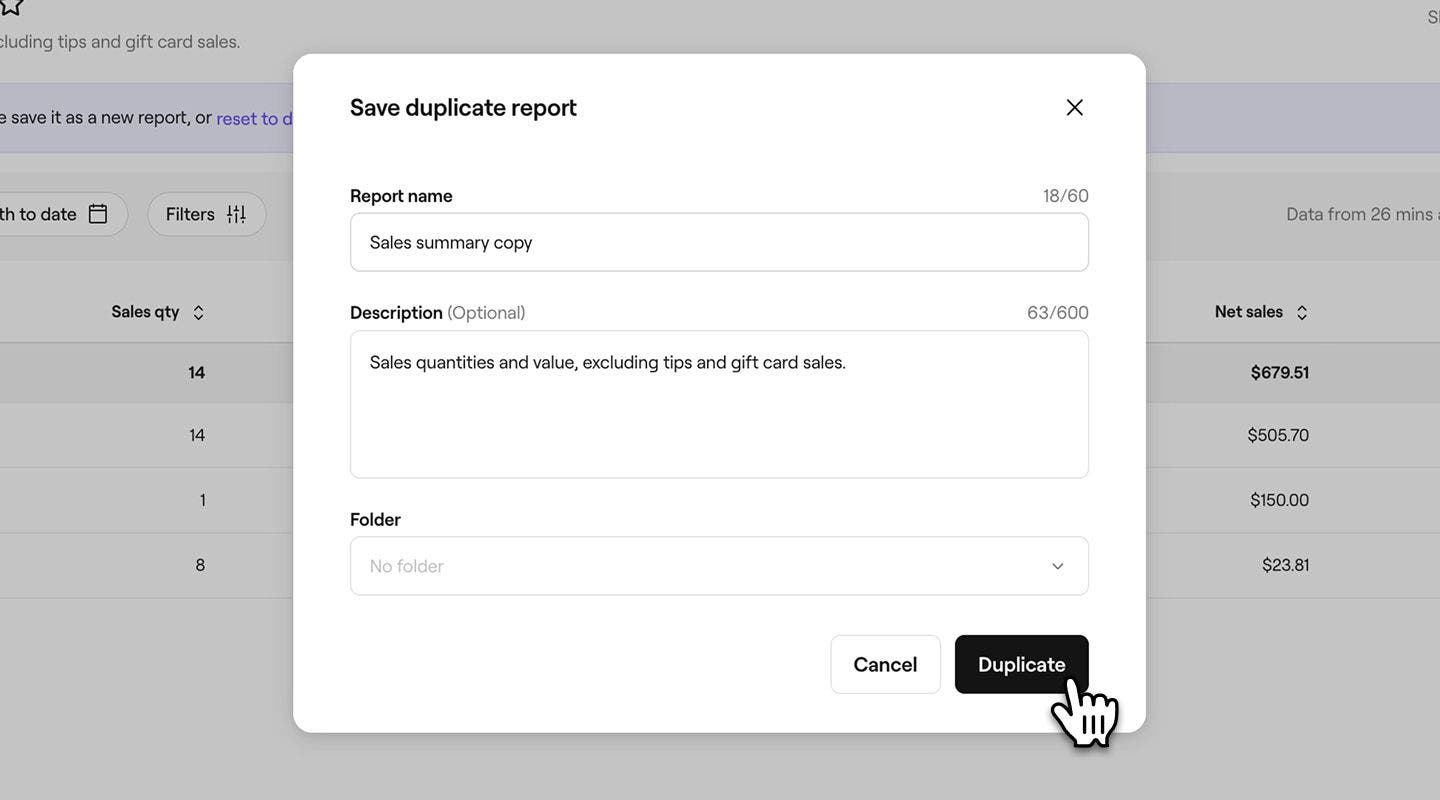
- In the pop-up, enter a new name and description for the report. By default, all duplicates will have "copy" added to the report name, so adding a description can help you tell them apart.

- Under Folder, use the drop-down to select a folder to save the report in, or create a new one by entering a folder name. If no folder is selected, the report will appear under the Custom section in your reporting.
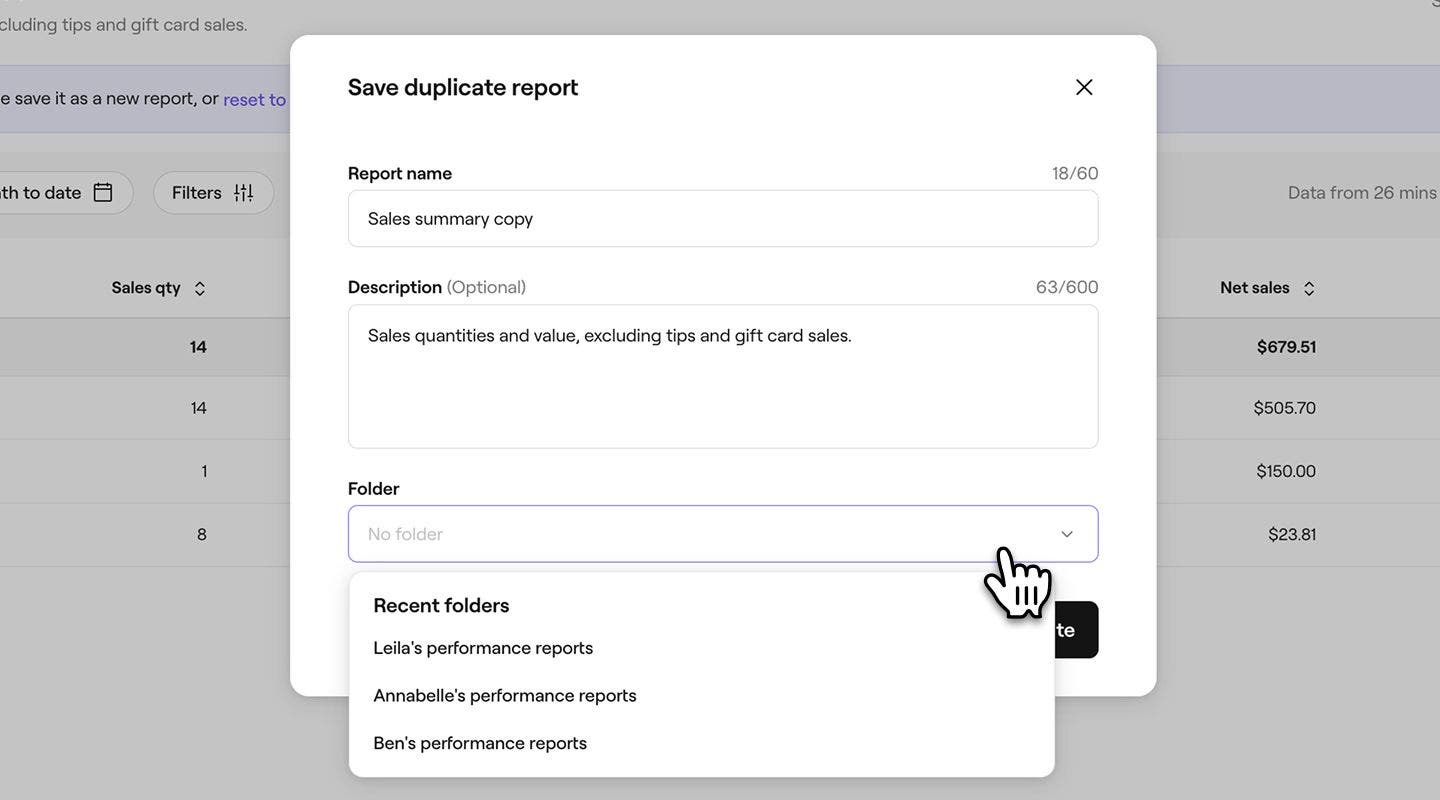
- Click on the Duplicate button at the bottom to save your changes.
Create new custom reports
You can build custom reports tailored to your business needs, giving you the exact data and insights you want.
- From the main menu on the left of your screen, go to Reports.
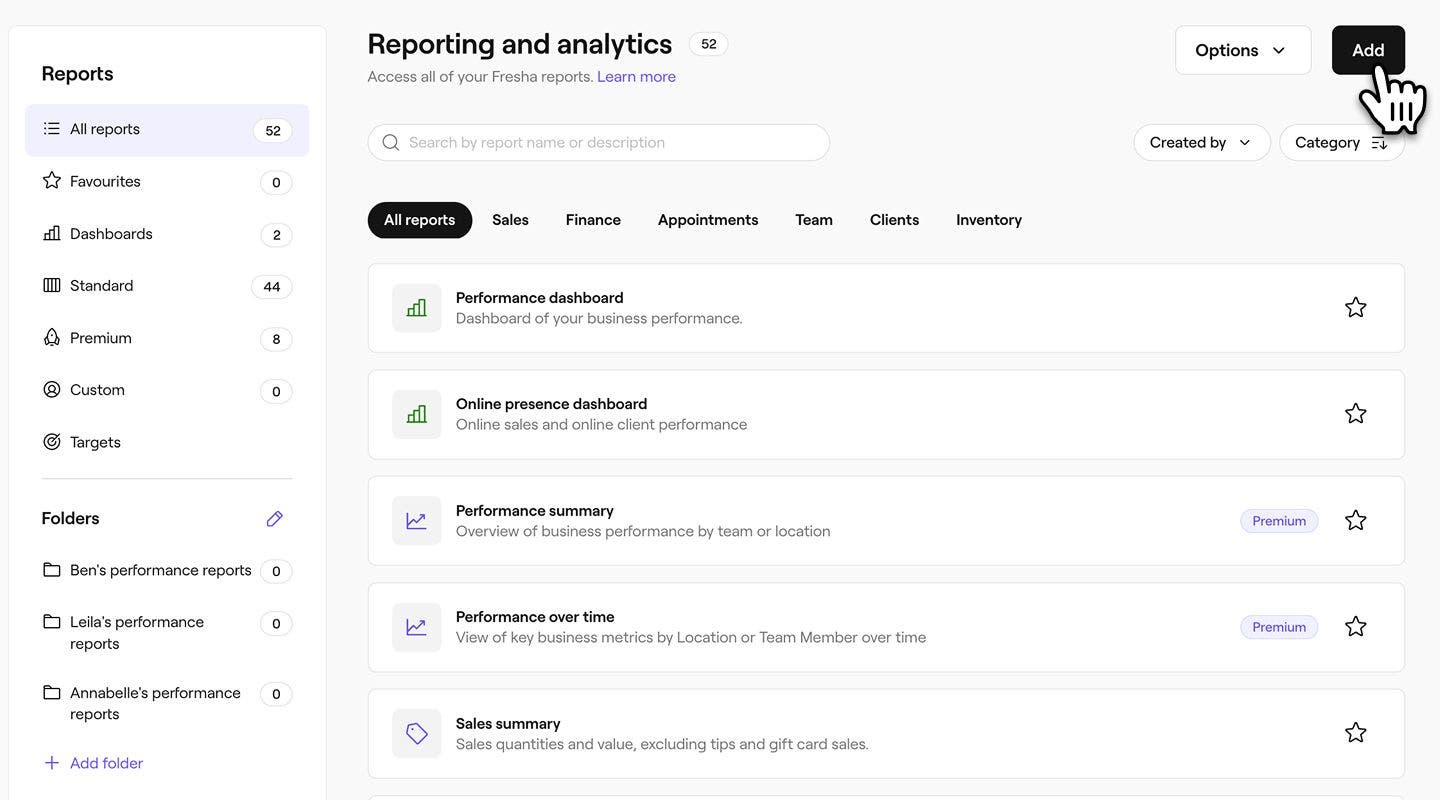
- Click on the Add button in the top right of your screen to create a custom report.
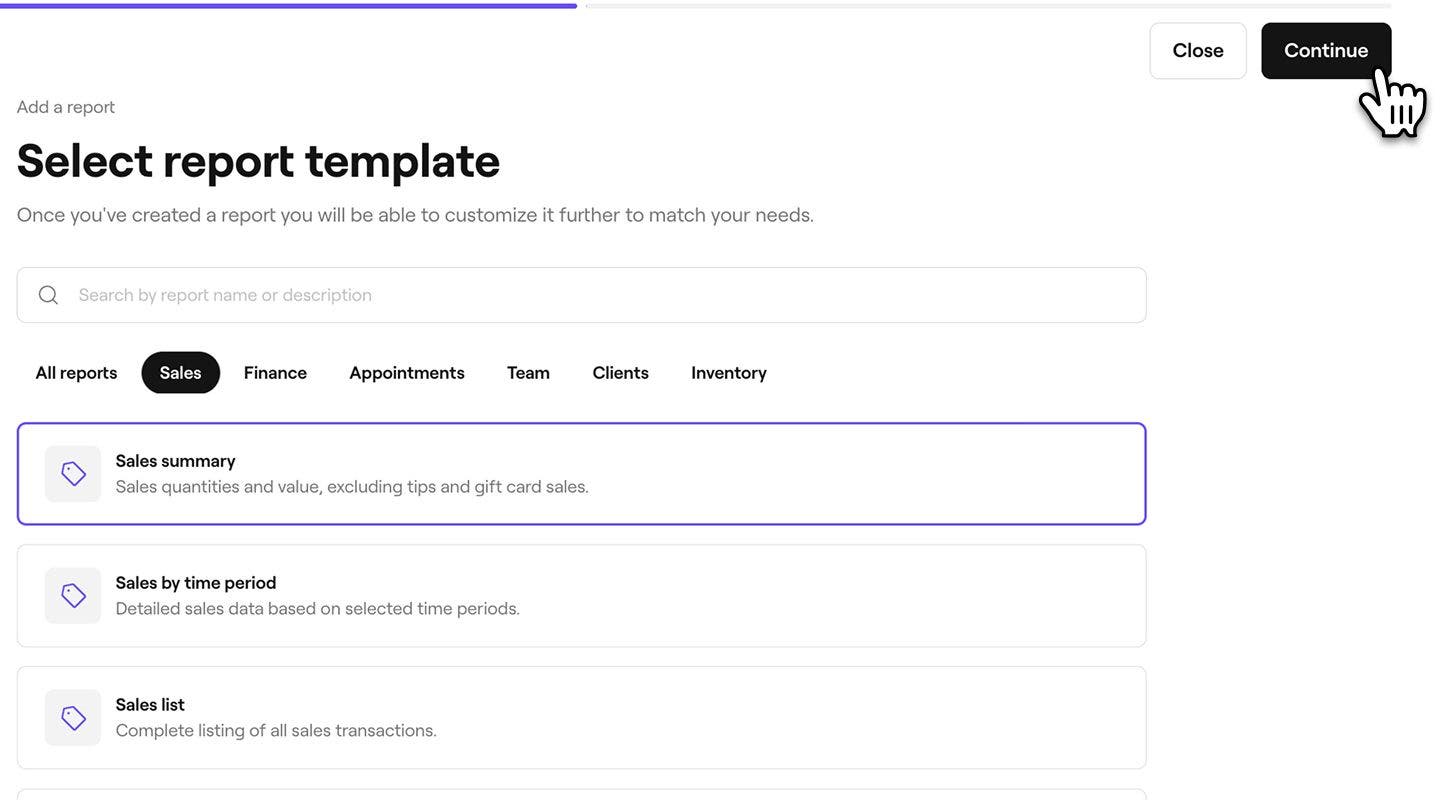
- Use the search bar at the top to enter the name or description of the report you want to use as a template, and select the report. Click on the Continue button in the top-right to proceed.
- In the next step, you can enter a new name and description for the report. By default, the template will have "copy" added to the report name so that you can tell them apart from the original.
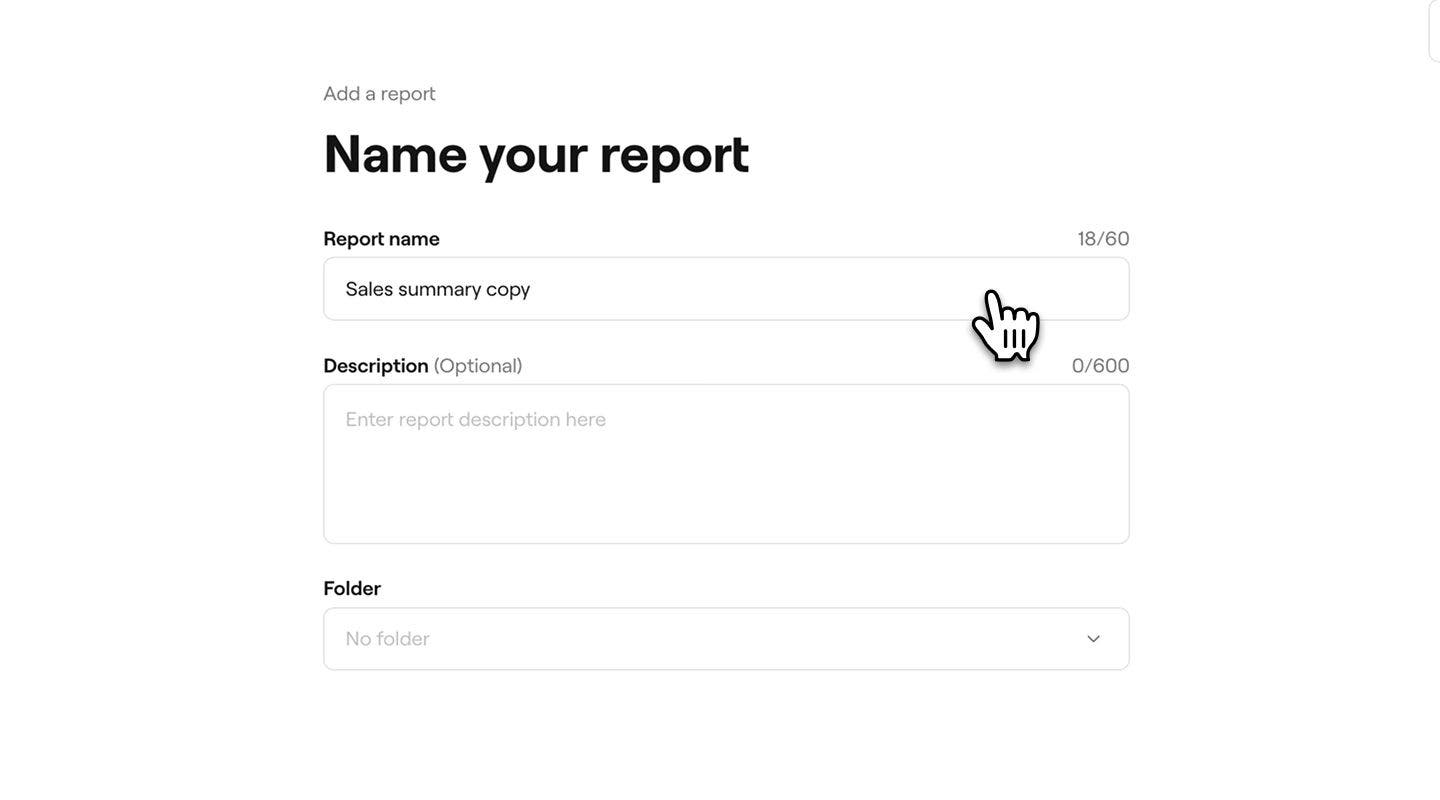
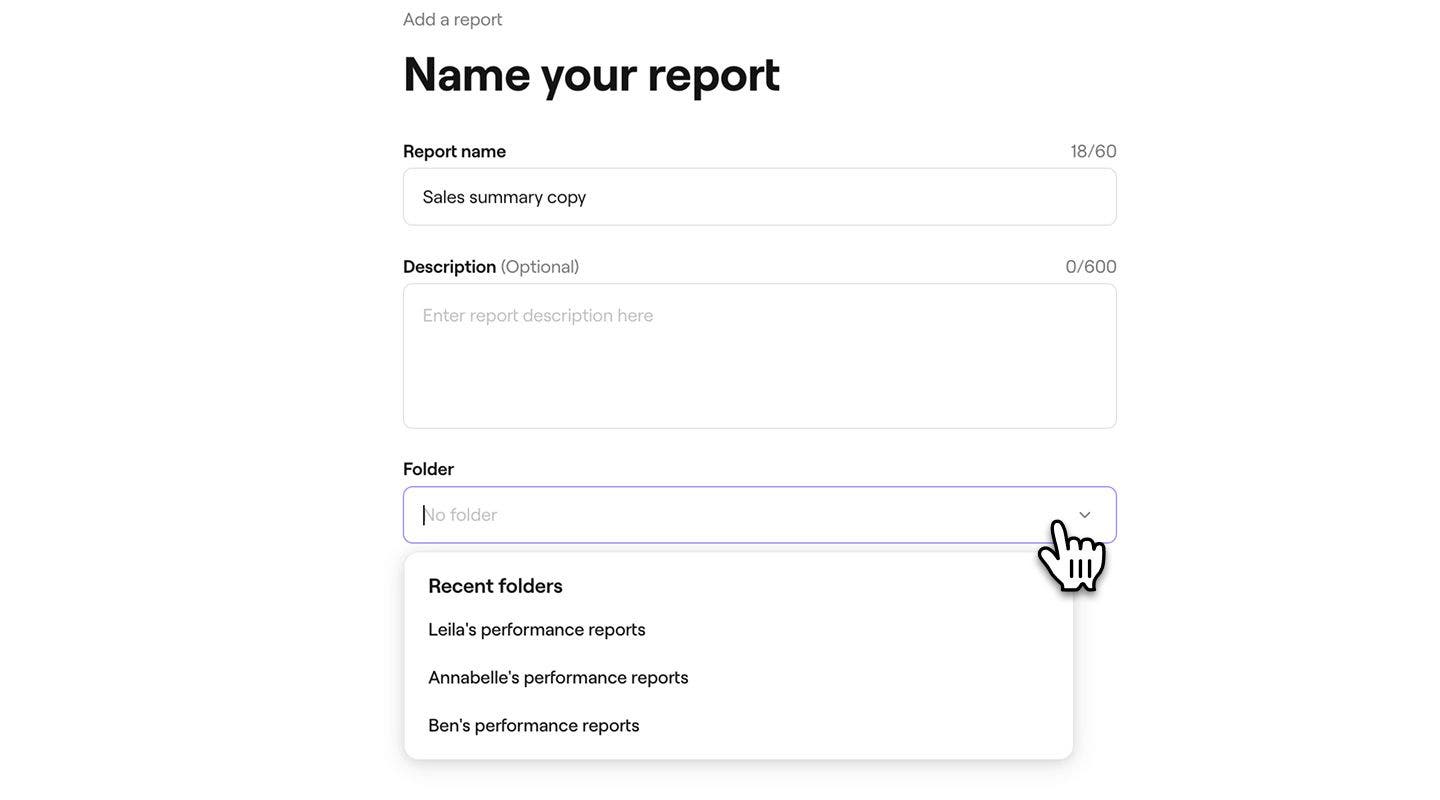
- Under Folder, use the drop-down to select a folder to save the report in, or create a new one by entering a folder name. If no folder is selected, the report will appear under the Custom section in your reporting.
- Click on the Add button in the top right of your screen to save your report.

- From the right menu tab, use the Customize menu to tailor the report to your needs. Open each filter tab and select the data you want to include, making sure the areas you’d like to see in the report are checked.
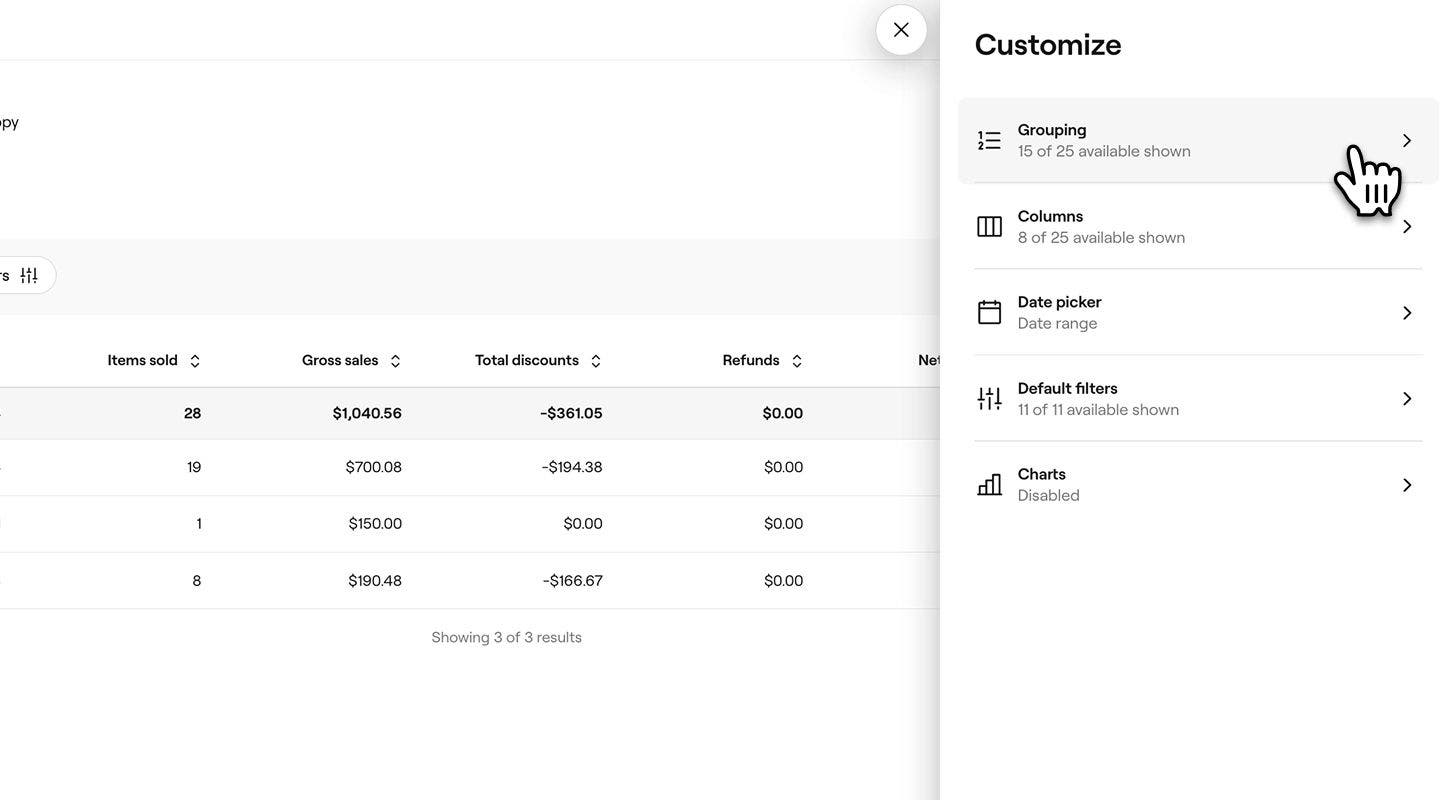
- Once you have selected the filters, click on the Apply button at the bottom of the panel to run the report.
Once you’ve created a custom report, you can adjust the filters anytime by clicking Customize to open the menu.
FAQs
- Filter on any report and report column without limitations.
- Hide and move columns left or right to prioritize the data that’s most important to you.
- Apply conditions like greater than, less than, or equal to when filtering numeric fields such as sales and quantities. For example, you can filter team member gross sales greater than $100.
- Combine rules using AND or OR logic to create more detailed views. For example, you can filter for net sales greater than £100 or items sold greater than 10.
You can create a custom report that includes the filters you need from each report, or you can duplicate and customize individual reports to match your business needs.
With Insights, there’s no limit to the number of custom reports you can create, giving you the flexibility to build as many as you need to suit your business.
You can undo custom report filters by disabling any filters you no longer want applied. Simply open the report, click Customize in the top toolbar, and update the filters in the Customize menu.
With Advanced filters, you can: